
Folder 4 Denmark's sustainable energy future
to sitemap
Concern over the use of fossil fuels comes from a very obvious fact that any non-renewable source of energy is bound to be used up after a period of time.
The first person to bring this to the attention of the public was Marion King Hubbert in 1949 in an issue of the Science Journal.. He suggested that the production of coal and oil would reach a peak in production and then decline as the resources ran out.
Much is now written about the Hubbert Peak since it is a matter of conjecture as to when the production maximum will occur - this year, next year, some year in the distant future - are all possibilities. Tied in with such forecasts are questions of security of supply and the pricing of fossil fuels. Technologies of energy supply which now appear very uneconomic will possibly be our mainstay for future supplies. A very topical example of this is the present worldwide interest in Fracking. Specialised drilling techniques of directional drilling have been possible for some time so that bore holes may be drilled vertically and then directed in a horizontal direction. Thus, gas filled shale seams can be explored and then fractured to allow gas to be extracted. However, the fear of environmental damage by this Fracking process is currently under review and, although the technique has found widespread use in the United States, it may not be adopted in the UK.
Hubbert followed the 1949 article with a more substantial document in 1956 suggesting that the Peak may occur around 2010/20 so that from the mid-1950's there has been a nagging concern that all is not well with an ever increasing use of fossil fuels. Unfortunately, politicians are not well versed in dealing with energy planning over time periods of several decades and, ironically, in the early 1960's the UK was just discovering North Sea oil so energy supplies did not seem to be a problem for the country.
Denmark was in a less favourable position then the UK with regard to energy supplies. In the early 1970's Denmark had a 90% dependency on oil imports for its energy needs. The oil crisis of 1973 therefore came as a shock in Demark whereas the UK was marginally effected as North Sea oil and gas was starting to flow.
The Danish government took immediate action to make the country less reliant on oil. Subsequent National Energy Policies were very effective at developing renewable energy sources, cutting down waste heat from electrical power stations through District Heating initiatives ( Combined Heat and Power) and getting people to use less energy.
The Figure below show how the energy mix has changed over the years and projections to this mix show that oil dependency will continue to fall with the total energy falling to 700 PJ by 2030.
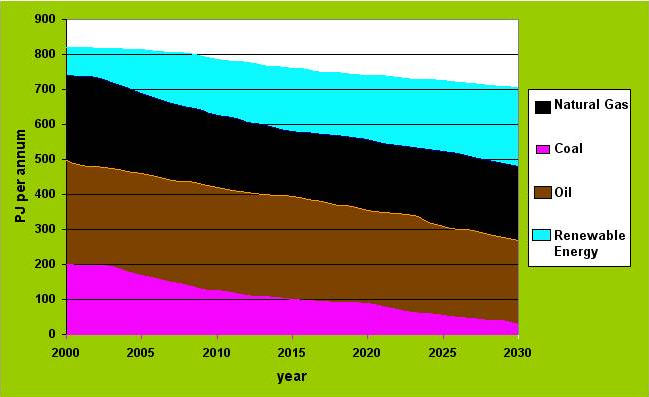
The chart shows that oil consumption, which was at record highs approaching 800 PJ per annum in the early 1970's, has been reduced to 300 PJ per annum and is likely to fall to about 200 PJ per annum in 2030. Renewable energy, on the other hand will increase to over 200 PJ by the year 2030. The forecast for the total energy consumption gives a reduction to about 700 PJ per annum and hence the Danish government has greatly increased the security of supply and made savings to its energy bill.
Note - Denmark has very good policies regarding waste, the incineration to landfill ratio is very high indeed - about 1.1 whereas it is much less than 1 in the UK.
A good reference article, J Amos - Denmark's sustainable energy future, Engineering Sustainability ,Volume 156, p 34 - 40, March 2003
Copenhagen hosted the Climate Change conference (7th to 18 December 2009) the Danish people can be rightfully proud of their achievments -
Given in the "Danish Example" -- since 1980, the Danish economy has grown by 78%, energy consumption has remained constant and CO2 emissions have been reduced.
RECENT FACTSHEET
Policy Background
The EU is working to reduce the effects of climate change and establish a common energy policy. As part of this policy, European Heads of State or Government agreed in March 2007 on binding targets to increase the share of renewable energy. By 2020 renewable energy should account for 20% of the EU's final energy consumption (8,5% in 2005). To meet this common target, each Member State needs to increase its production and use of renewable energy in electricity, heating and cooling and transport. Although renewable energies are an integral part of our fight against climate change, they also contribute to growth, job creation and increase our energy security.
Country targets
The renewables targets are calculated as the share of renewable consumption to gross final energy consumption. Renewables consumption comprises the direct use of renewables (e.g. biofuels) plus the part of electricity and heat that is produced from renewables (e.g. wind, hydro), while final energy consumption is the energy that households, industry, services, agriculture and the transport sector use.
Key issues
Due to an average growth of 71% per year, Danish offshore wind capacity remains the highest per capita in Europe (400 MW in total in 2006). Denmark is at present close to reaching its Renewable Energy Strategy (Electricity) RES-E target for 2010. Two new offshore installations, each of 200 MW, are under preparation. RES other than offshore wind are slowly but steadily penetrating the market, supported by a wide array of measures such as a new repowering scheme for onshore wind.
Denmark has been slow in introducing biofuels to the market and is behind on its EU target.
Main supporting policies
In order to increase the share of RES-E in overall electricity consumption, Denmark has implemented the following measures:
o A tendering procedure has been used for two new large offshore installations. Operators will receive a spot price and initially a settling price as well. Subsequent offshore wind farms are to be developed on market conditions.
o A spot price, an environmental premium (EUR 13/MWh) and an additional compensation for balancing costs (EUR 3/MWh) for 20 years is available for new onshore wind farms.
o Fixed feed-in tariffs exist for solid biomass and biogas under certain conditions.
o Subsidies are available for CHP plants based on natural gas and waste.
The generation of Renewable Energy Strategy (Heating) RES-H is supported by means of tax exemptions. Biomass, being CO2 neutral, is exempt from CO2 duty. Solar heating plants are exempt from both energy and CO2 taxes. The Executive Order "Solar heating obligations in new buildings outside the district heating areas" (no. 337) was adopted in 2001 but has not yet come into force. It will require the introduction of solar heating from owners of new buildings (excluding the domestic sector). Solar thermal installations are also eligible for subsidies. Both regulations apply only outside district heating areas.
23 January 2008
Denmark - Renewable Energy Fact Sheet2/3
Biofuels have been exempt from the CO2 tax imposed on ordinary petrol and diesel for transport
since January 2005; this is currently the main supporting measure for biofuels. In early 2008 a bill
will be presented to Parliament, instructing all filling stations to sell at least 5.75% biodiesel and
bioethanol as of 1 January 2010.
Key figures1
For further information
To find out more about renewables, go to: http://ec.europa.eu/energy/res/index_en.htm
http://ec.europa.eu/energy/intelligent/index_en.html
To find out more about the current situation of renewables in the Member States, go to
http://ec.europa.eu/energy/res/legislation/electricity_member_states_en.htm
http://ec.europa.eu/energy/res/legislation/share_res_eu_en.htm
To find out more about support measures, go to
http://ec.europa.eu/energy/res/legislation/support_electricity_en.htm
To find out about a project or contact an energy agency in your region, go to
http://www.managenergy.net/emap/maphome.html
1 Reliable and complete data for heating and cooling is not yet available from Eurostat
Gross Electricity Generation by fuel (2005) Final Energy Consumption by Fuel, Transport (2005)
Source: Eurostat
![]()
* Not including generation from hydro pumped storage, but including electricity
generation to pump water to storage. Municipal Solid Waste, Wood waste, Biogas
Additional Numerical Information regarding units
American literature can be confusing as the billion or quadrillion can mean different conversion multipliers - a billion can be a million million or a thousand million.It is customary in UK to take a billion as one thousand million and a quadrillion (sometimes called a Quad) as a thousand million million.
Other conversions are necessary for energy units as the Americans often adopt the British unit (BTU or British thermal unit) instead of the usual unit, namely, the Joule. Also, since we rely so much on oil these days an oil equivalent of energy is often used.
We see that 1 million tonnes oil equivalent (Mtoe) is equal to 42 Peta Joules (PJ) or 3.97 x 10¹³ BTUs. Now since a Quad is 1015 BTU then 1Mtoe is 0.0397 Quad.
Note also that 1 kiloWatt hour (kWh) is 3.6 MJ and 1BTU is 1.055 kJ
go to top of page